
Almost every infrastructure vendor now ships its own monitoring platform. Buy network hardware, servers, or storage, and the dashboard comes with it. It is purpose-built for the product architecture, so it often provides more detailed information than a generic tool while remaining simple and functional.
However, complexity kicks in because most enterprises do not run on a single vendor. Networks may come from one or two providers, firewalls from another, and servers, virtualization, storage, and cloud workloads from others. Each layer brings its own dashboard and its own idea of a healthy system. Visibility is not missing; it is spread across a dozen consoles that do not talk to each other, and no one place shows how the whole environment is doing.
The usual response is to buy something that sits above all of it and promises one view.
Gartner groups these under IT infrastructure monitoring, or ITIM: tools meant to capture the health of servers, networks, hypervisors, and storage in one place. The promise is a single view across all vendors. What arrives is often thinner than the picture the enterprise already had.
A general-purpose tool can only go as deep as each vendor's integration allows, and that depth almost always lags what the vendor's own console exposes. The richest data sits behind proprietary interfaces that the tool can access only in part. So teams keep logging into the native consoles for anything that matters. The second platform, and the people to run it, leaves the original visibility gap mostly open.
This is not a case against ITIM tools. For a uniform environment, or where broad metrics are sufficient, they are a reasonable choice, and that is what most teams buy them for. The gap appears as operations mature and need deeper data for troubleshooting, capacity planning, and service accountability that broad metrics cannot provide.
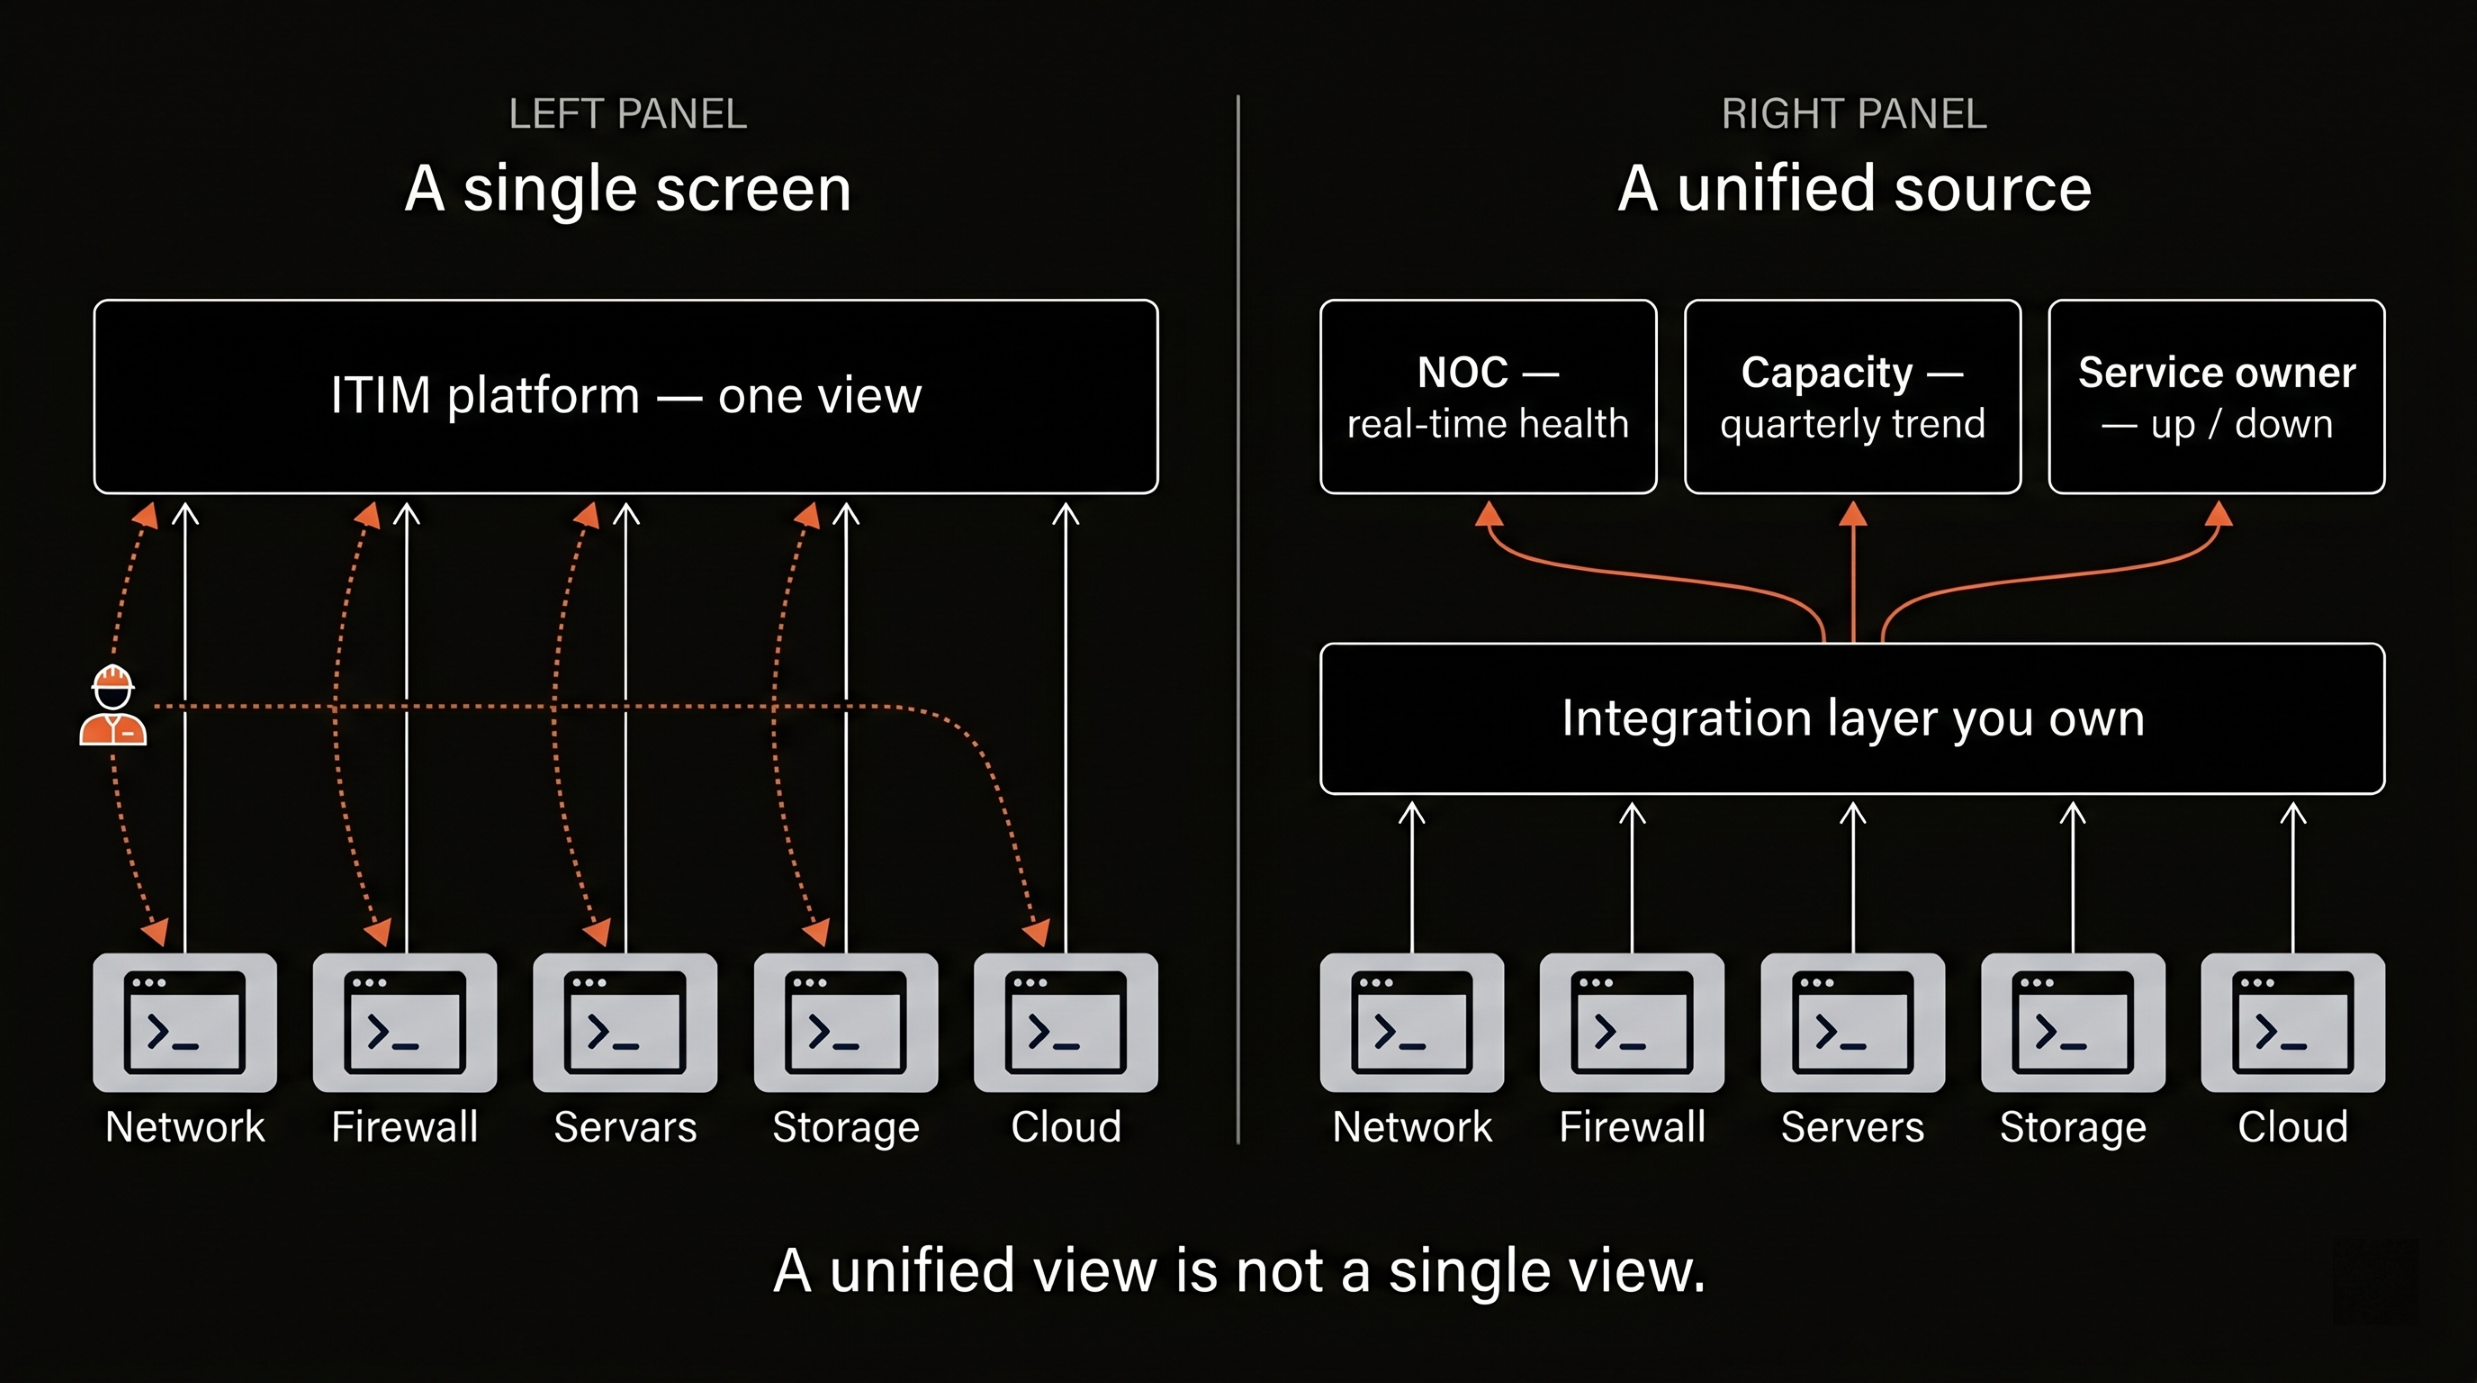
Pulling many sources together does not mean forcing everyone onto one screen. Different people need different things, and often the same thing at a different depth.
An NOC engineer wants a real-time health dashboard and to be alerted whenever alerts have just gone noisy. A capacity planner wants the last quarter’s trend. A service owner wants to know whether the service is up, not which port is flapping. A single view is not one dashboard that tries to satisfy all of them. It is the underlying data brought together so each view can be served from it, at the depth each needs, without anyone hopping between vendor consoles to assemble the picture by hand.
That is the quiet payoff of consolidation done well: many sources pulled into one place, and the views each role actually uses drawn straight from it.
The native tools do not need to be replaced. Each one is the best source of truth for its own equipment. The work is to take what they already report, on their own terms rather than flattened to a common denominator, and consolidate it into a single source that the operations team controls. That is integration, and it is a capability you build into the operating model, where the cost shifts from a license to something you own. It is the same point that determines IT operations maturity more broadly: progress comes from connecting the systems you already have, not from buying a heavier one to sit on top of them.
For a single enterprise, this is a project. For Rogue Asia, managing many customers across multiple vendors is the daily norm, and we built the practice around integrating those sources rather than buying on top of them. From that one data set, we serve whatever each role needs to see, with our managed NOC monitoring and ITSM practice turning what it sees into resolved tickets and predictable operations.
If you are paying for a consolidated view and not actually getting one, the fix is probably not another tool. It usually starts with a clearer look at what your existing tools already tell you, and how little of it ends up in one place. That is a conversation we are glad to have.
